CyberQ
A Usability Testing Case Study
Overview
Role
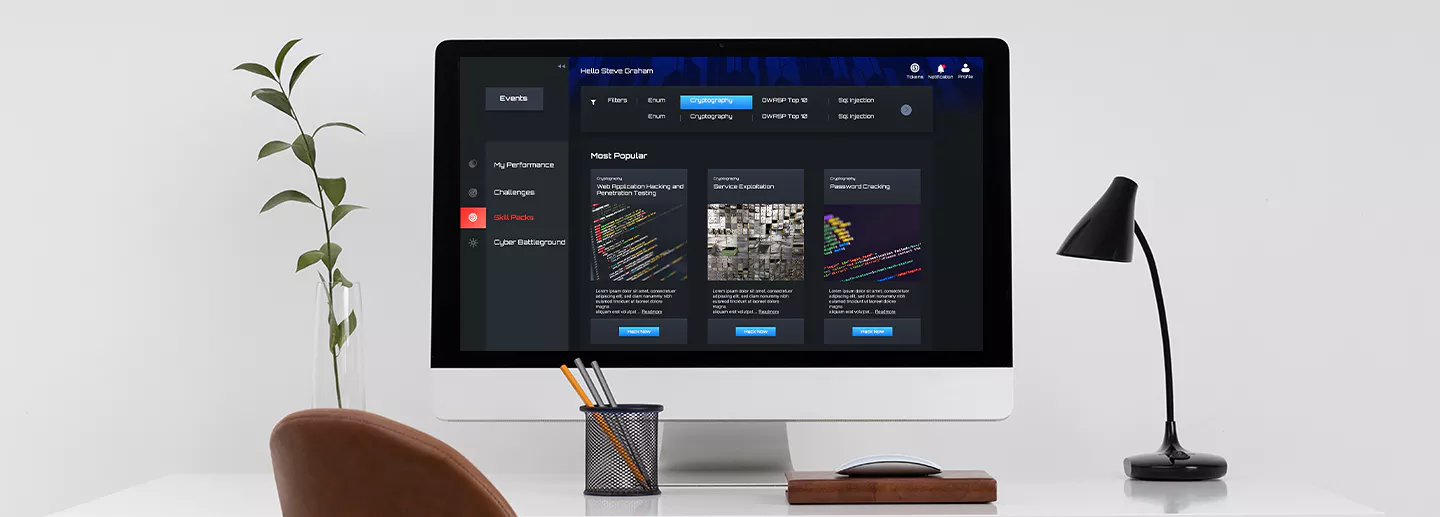
CyberQ is a cyber range platform designed to assess and
improve cyber security skills in individuals, teams, and
organisations. It is a tailored solution for honing and
demonstrating proficiency in the field of cyber security.
Asst UX Manger
User Research,Prototyping & Testing,
Visual Design
The Challenge
At CyberQ, our goal is to provide a platform that allows users to complete cyber ranges (a combination of cyber challenges and tasks) efficiently and effectively. However, during the Hacker halted hackathon, we noticed that many participants were struggling to complete multiplayer cyber ranges within the allotted time. Upon further investigation, we found that a lack of a two-monitor setup was a significant factor in their difficulties.Research
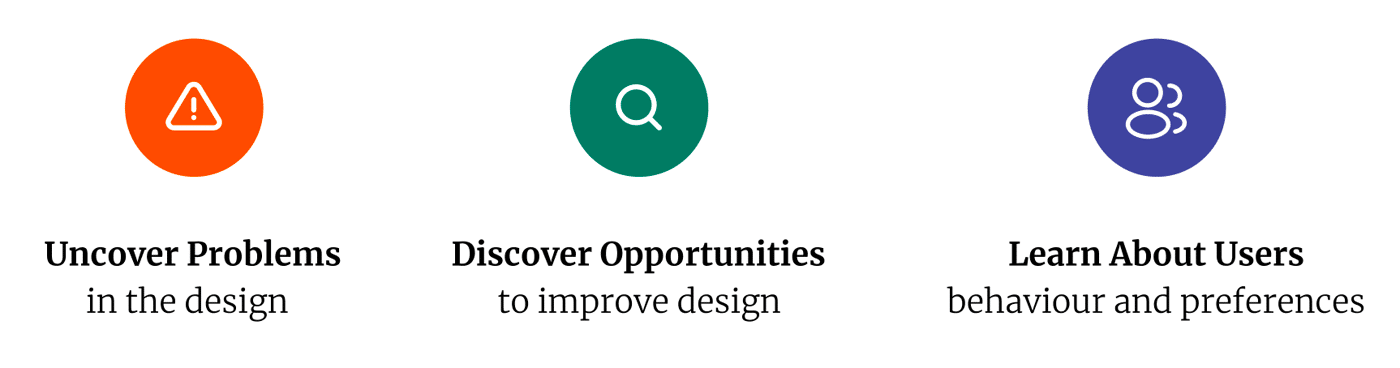
To better understand and address these challenges, we conducted a
usability test to identify any pain points in the user experience.
Through this process, we were able to identify multiple areas for
improvement and subsequently redesign certain aspects of the
platform to better meet the needs of our users.
Why Usability Testing
Test Goal | Unmoderated Remote Usability Testing
In order to continuously improve and optimise our platform, we have implemented a system to record and analyze complete sessions of multiplayer cyber range play. By doing so, we hope to identify any usability issues and address them in a timely manner. This will allow us to ensure that our users are able to fully engage with and benefit from the CyberQ platform.Participants
To improve the user experience on our platform, we gathered valuable feedback through usability testing with a diverse group of students from our university. This included both novice and experienced users, and we carefully selected a total of 10 members for both the blue and red teams to ensure a representative sample of diverse perspectives.Scenario
To evaluate the effectiveness and usability of our platform, we created a multiplayer cyber range with three tasks for each team. Each task included flags that participants needed to capture in order to complete it successfully. We conducted a usability test by recording and analyzing the interactions of users as they completed these tasks, using screen recorders to capture their journey. This allowed us to identify which features were most helpful, identify any missing features, and identify opportunities for improving the overall user experience.Strategy
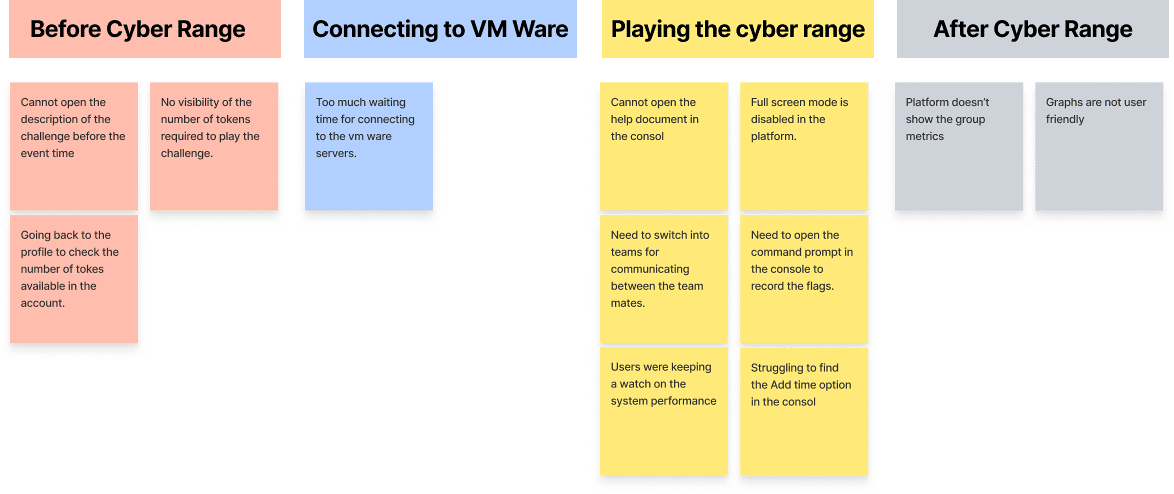
Affinity Map
To improve the user experience on our platform, we gathered valuable feedback through usability testing with a diverse group of students from our university. This included both novice and experienced users, and we carefully selected a total of 10 members for both the blue and red teams to ensure a representative sample of diverse perspectives.What Our Users Say
“The Tasks are logically organised and covers all the relevant
topics.
The biggest challenge is navigating in and out of VM Ware”
Analysis
To effectively address the issues identified through usability testing, we prioritized them using a 2x2 map. This allowed us to rank the categories of issues based on their importance to the business (x-axis) and to the users (y-axis).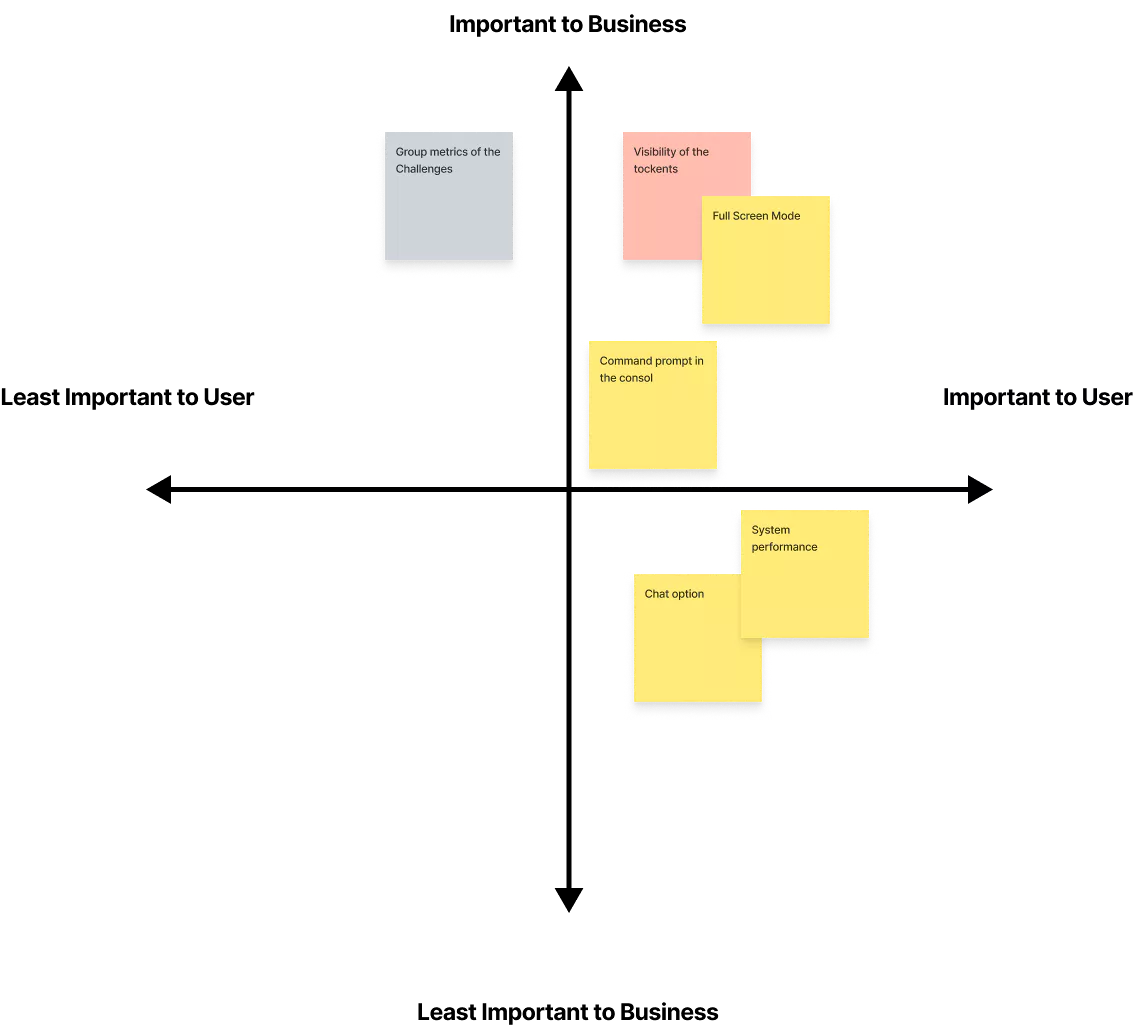
Defining The Problem
To identify and address any issues related to playing the multiplayer cyber range, we closely analyzed user behavior and patterns. By doing so, we were able to gain a deep understanding of the user experience and come up with targeted solutions to improve it. All 10 members need to come out of the server to access kali command prompt 6 people struggled in finding the available tokens in their accounts. 8 people opened system performance of their PC All 10 members minimised the the VM ware to chat with their team mates. All 10 members minimised the the VM ware to open the help document frequently. 4 people used full screen mode.Other Problems
Multiplayer Metrics is not availableDesign
Ideate and Create
To address the issues identified in the Console screen, we worked together to map out potential solutions and create high fidelity sketches to encapsulate these solutions. This allowed us to effectively visualize and communicate our proposed solutions, ensuring that they were feasible and effective in addressing the identified issues.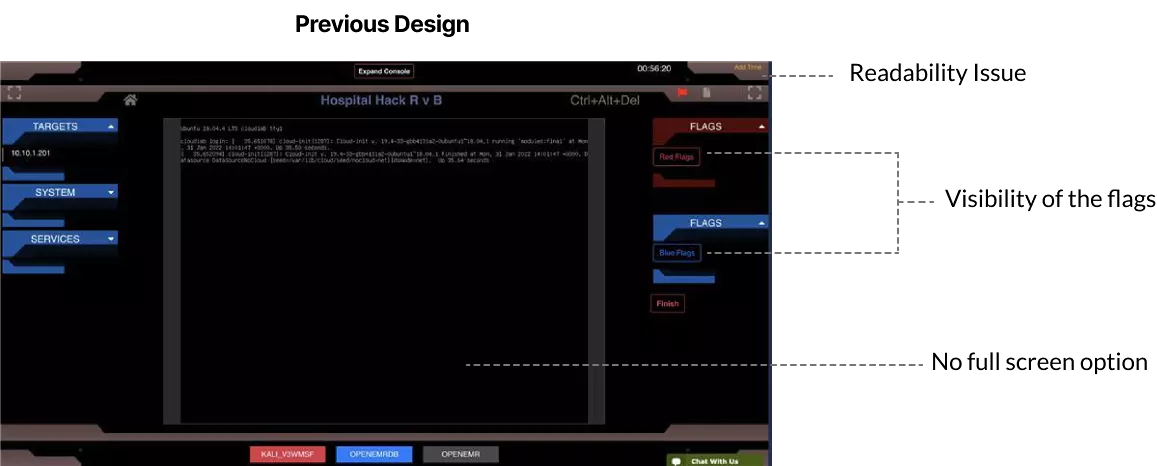
Before beginning the prototyping process, we conducted preliminary
validation by presenting UI sketches to product managers and
gathering feedback. We incorporated this valuable insight into the
final design, ensuring that it met the needs and expectations of
our users. This initial validation helped us create a more
effective and user-friendly design.
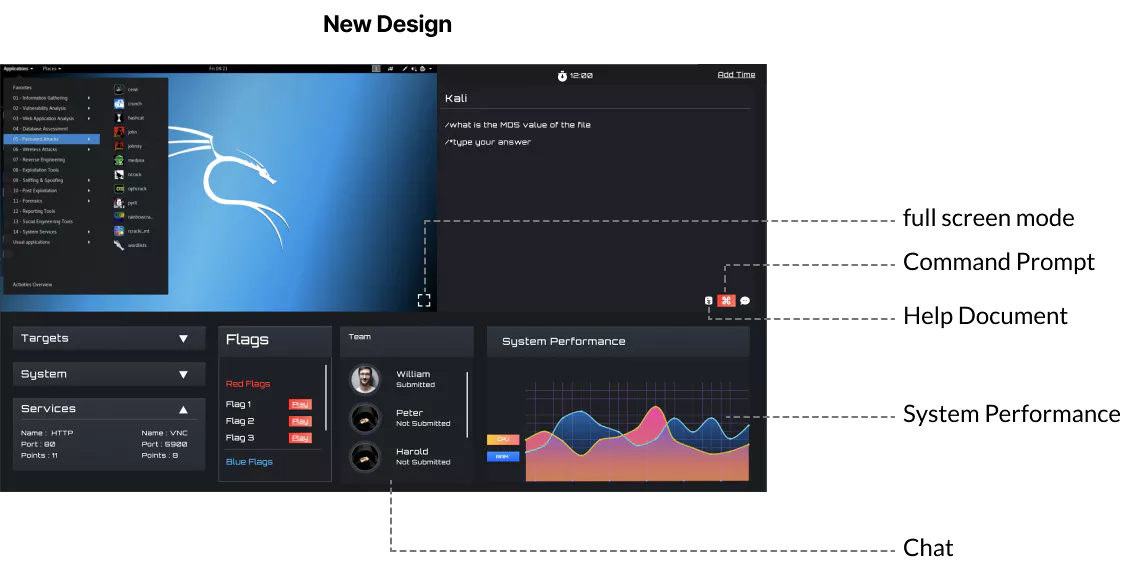
Customizable Console Screen
To better meet the needs and preferences of our users, we implemented customization options in the console. Users can now easily add or remove sections from the window menu according to their specific requirements. This feature allows users to tailor the platform to their individual needs, improving the overall user experience.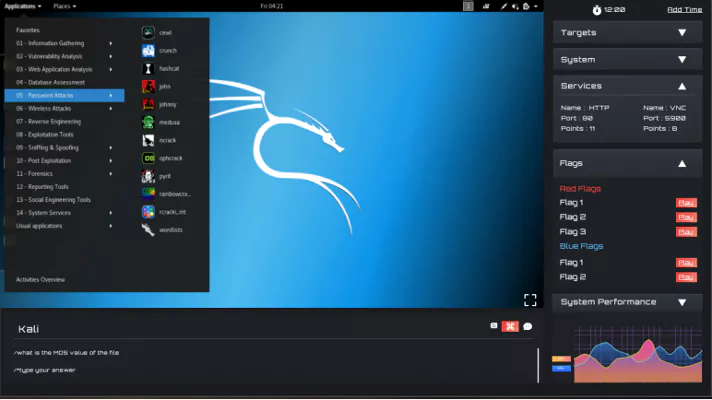
Adding Metrics
In response to requests from the university and business partners who use CyberQ for training, we have implemented a new feature to track and report on the performance of individual players in multiplayer cyber ranges. To help users easily track and compare their performance with that of their teammates, we designed graphs that can gather and display a wide range of data, including multiple objectives and subgroups within both the blue and red teams. This allows users to view all relevant information in a single, clear overview and understand their progress and areas for improvement.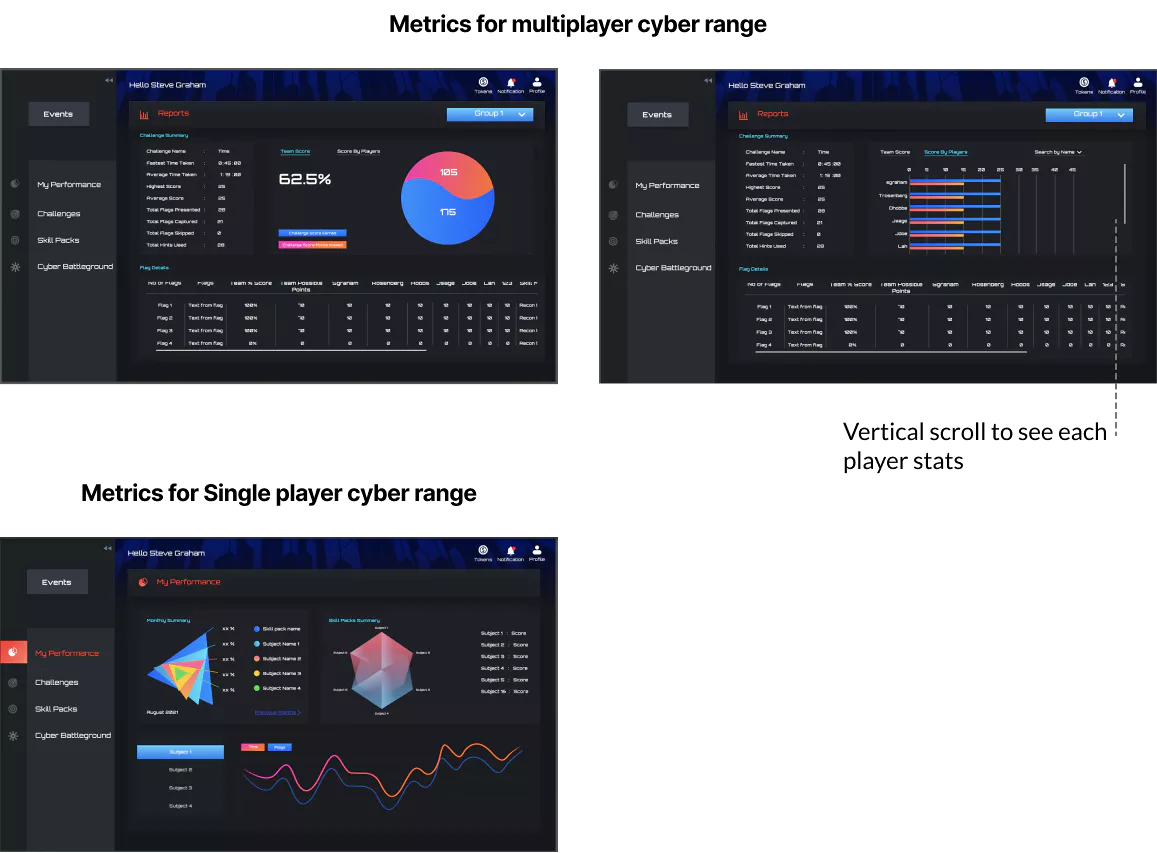
Validation
To ensure that our design solutions were effective in improving the user experience, we tested them in the staging environment with a group of 5 students. Prior to implementing these changes, the average time taken to complete the cyber range was 20 minutes. However, after implementing the changes, we saw a significant reduction in the average completion time, with students completing the same cyber range in an average of 15 minutes. This demonstrated the effectiveness of our design solutions in improving efficiency and user satisfaction on the platform.More Projects